

Table of Contents
Understanding your company’s earnings is fundamental to evaluating its performance, and that starts with knowing “what is annual revenue”. Annual revenue is the total income a business generates from its core operations over 12 months, before any expenses are deducted. It’s not just a number—it’s a key indicator of financial health, profitability, and growth potential.
Whether you’re managing a startup or leading a multinational corporation, accurately tracking annual revenue helps inform strategic decisions, attract investors, and ensure long-term sustainability. But how is annual revenue calculated, and what does it say about your business?
In this guide, we’ll break down the definition, explain its significance, and walk you through the steps to calculate annual revenue clearly and confidently. Let’s dive in!
What is annual revenue?
To define annual revenue in its simplest form, it is the total income a company earns from its primary business activities, such as selling goods or providing services, over 12 months. The annual revenue meaning focuses solely on operational earnings and does not include income from non-operating sources like interest, dividends, or one-time asset sales.
As the “top line” on the income statement, annual revenue reflects the business’s size and market presence, rather than its profitability.
Annual revenue vs. Income vs. Profit
While often used interchangeably in casual discussions, the terms annual revenue, income, and profit represent distinct financial metrics:
| Term | Definition | Key Use |
| Annual Revenue | Total earnings from core operations over one year, before any deductions. | Measures business activity and scale. |
| Income | Earnings are calculated after deducting expenses from revenue. Split into: | Shows earnings after specific deductions. |
| – Gross Income | Revenue minus COGS. | Indicates profitability before OPEX. |
| – Net Income | Final profit after all expenses, interest, and taxes. | Measures true financial performance. |
| Profit | Revenue minus all costs (can be gross or net). | Reflects actual profitability. |
This distinction is crucial. Annual revenue tells you how much a business brings in; income and profit show how well the business manages costs to generate earnings.
What is annualized revenue?
Unlike annual revenue, which reports actual income over a completed 12-month period, what is annualized revenue refers to a projection. It estimates full-year revenue based on current or partial data. For example, if a company earns $250,000 in Q1, its annualized revenue would be projected as $1,000,000 for the year.
Annualized revenue is especially useful for forecasting, budgeting, or comparing newer businesses that haven’t yet completed a full fiscal year. While it’s not an exact figure, it helps stakeholders evaluate growth potential and make more informed decisions.
Understanding the annual revenue definition and how it differs from income and profit is essential for accurate financial analysis. It offers a snapshot of your company’s market performance and lays the foundation for a deeper evaluation of sustainability and profitability.
Whether you’re preparing financial reports or attracting investors, knowing how to interpret and calculate annual revenue can significantly enhance your strategic planning.
Why is annual revenue important?
Understanding “what are annual revenues” is fundamental to evaluating a company’s financial health. While it doesn’t reflect profit, annual revenue serves as a powerful indicator of a company’s market presence and performance. Here’s why annual revenue is so important:
- Assessing business scale and market activity
Annual revenue reveals the size of a company’s operations and how actively it participates in its market. A high revenue figure signals strong demand and operational reach.
- Tracking growth trends
Monitoring annual revenue year-over-year helps identify whether a company is growing, stagnating, or declining. This trend analysis supports long-term sustainability.
- Guiding investment decisions
Annual revenue data assists business leaders in deciding where to allocate resources, such as expanding product lines or entering new markets, based on revenue contributions.
- Attracting investors and lenders
Investors and financial institutions use annual revenue to evaluate risk and potential return. Strong, consistent revenue growth often leads to favorable financing terms.
- Measuring performance over time
Revenue acts as a benchmark to evaluate strategic success. It shows how effectively a company converts its offerings into income.
- Informing strategic decisions
From hiring to marketing and development, revenue insights influence essential business choices that shape future direction.
Factors influencing annual revenue
Understanding the annual revenue meaning is essential when evaluating a business’s financial performance. It represents the company’s total income over a year through its core and non-core activities.
However, this figure does not arise in isolation—it is shaped by a range of dynamic factors that influence both the volume and value of sales. Below are key elements that can significantly impact annual revenue:
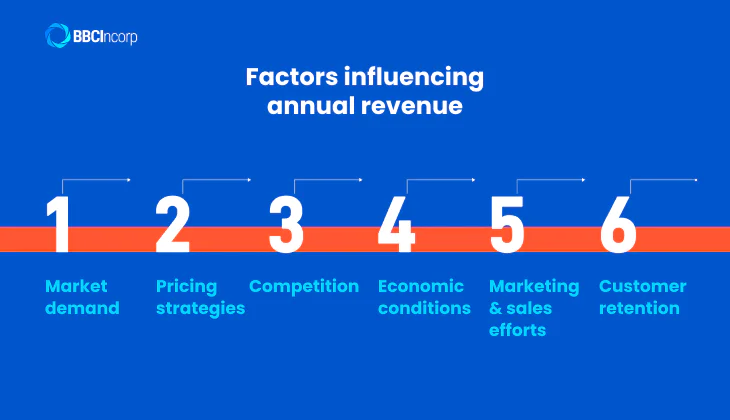
- Market demand
High demand for a company’s products or services drives increased sales, directly boosting revenue. Shifts in consumer preferences or emerging trends can dramatically alter demand levels.
- Pricing strategies
How a business prices its offerings affects revenue potential. Premium pricing may yield higher returns per unit, while competitive pricing may attract more customers.
- Competition
A crowded market can pressure companies to lower prices or invest more in marketing, which may reduce margins or slow revenue growth.
- Economic conditions
Recessions, inflation, and currency fluctuations can influence consumer spending power, thereby affecting annual revenue positively or negatively.
- Marketing and sales efforts
Effective campaigns and strategic sales initiatives help increase visibility and conversion rates, ultimately improving revenue performance.
- Customer retention
Long-term customer relationships lower acquisition costs and encourage repeat purchases, creating a steady revenue stream and enhancing financial predictability.
Is annual revenue gross or net?
When evaluating a company’s financial performance, a common question arises: Is annual revenue gross or net? The answer depends on how the revenue is calculated. To clarify, let’s break down each term and its significance.
The gross annual revenue definition refers to the total income a company generates over 12 months before subtracting any costs or deductions. It includes all sales of goods or services, making it a key indicator of a company’s top-line performance.
For example, if a company sells 10,000 units at $50 each in a year, its gross annual business revenue would be $500,000—regardless of any product returns or discounts.
In contrast, net revenue (or net annual revenue) is calculated by deducting returns, discounts, allowances, and similar expenses from gross revenue. This provides a clearer view of the actual earnings from sales activities.
Key differences between gross and net revenue:
- Gross revenue: Total sales before any deductions.
- Net revenue: Income after subtracting returns, allowances, and discounts.
Annual revenue refers to revenue measured across a full fiscal year. It can be expressed in gross or net terms depending on the financial analysis objective. For example, while gross annual revenue helps evaluate market reach and sales volume, net revenue is essential for understanding profitability and operational efficiency.
In summary, both gross annual revenue and net revenue offer valuable insights, but serve different purposes. Businesses must assess both to make informed decisions and maintain financial health.
How to calculate annual revenue?
Calculating annual revenue is a fundamental task for any business, as it provides a clear view of how much income your company generates through its core operations over a fiscal year. This figure is essential for evaluating business performance, forecasting, and strategic planning. Here’s a comprehensive, four-step guide to help you determine your annual revenue accurately.
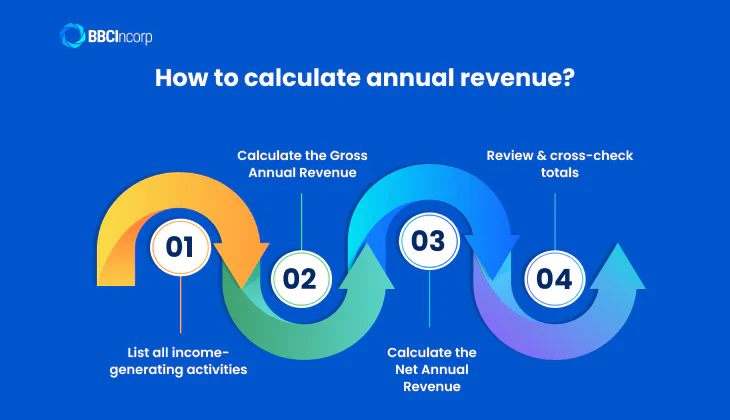
Step 1: List all income-generating activities
Begin by identifying all the sources of income your business earns from its primary operations. These may include:
- Sales of physical products
- Service fees
- Subscription or membership charges
- Licensing fees
Avoid including non-operating income, such as interest, investment gains, or proceeds from selling company assets. These are not part of annual operating revenue and should be reported separately on financial statements.
Take the time to compile sales data for each product or service, including the quantity sold and the average selling price. If prices fluctuate during the year, record them based on when and how they changed to ensure accuracy.
Step 2: Calculate the Gross Annual Revenue
Once all operational income sources are listed, calculate Gross Annual Revenue using the following formula:
Gross Annual Revenue = Number of Products or Services Sold × Average Sales Price
Apply this formula to each product or service line, then sum the individual revenues to find the total annual gross revenue.
Example:
A handmade jewelry business sells the following items annually:
- 500 Necklaces at $200 each → $100,000
- 750 Rings at $100 each → $75,000
- 1,000 Bracelets at $75 each → $75,000
Gross Annual Revenue = $100,000 + $75,000 + $75,000 = $250,000
This total reflects all earnings from core business activities before any deductions.
*Note: Non-operating income, such as interest earned, investment returns, or proceeds from asset sales, should not be included in annual revenue calculations. Annual revenue focuses solely on income derived directly from core business activities.
Step 3: Calculate the Net Annual Revenue
To get a clearer picture of real business earnings, calculate Net Annual Revenue, which accounts for deductions like customer returns, discounts, and allowances.
Net Annual Revenue = Gross Annual Revenue − Returns − Discounts − Allowances
Example:
If the jewelry company had the following adjustments:
- Returns: $5,000
- Discounts: $2,500
- Allowances: $1,000
Then,
Net Annual Revenue = $250,000 − $5,000 − $2,500 − $1,000 = $241,500
This figure offers a more accurate representation of the business’s operational success.
Step 4: Review and cross-check totals
Finally, verify the accuracy of your calculations. Cross-reference your figures with financial statements such as your income statement, sales reports, or accounting software outputs. This ensures that no revenue streams are missed and that all figures align correctly.
If your business uses automated tools, this step may be simpler. For manual accounting, ensure that data from invoices, receipts, and bank statements are consistently recorded and match your final revenue calculation.
Best practices for reporting and analyzing annual revenue
Accurate reporting and thorough analysis of annual revenue are critical for measuring business performance and guiding strategic decisions. Below are key best practices that ensure clarity, consistency, and actionable insights:
- Use consistent reporting periods and definitions
Always align your reporting with fixed periods, such as calendar or fiscal years, and apply standardized definitions for revenue components. This ensures year-over-year (YoY) consistency and facilitates reliable comparisons across timeframes, avoiding confusion in stakeholder communications.
- Segment revenue by product, region, and customer type
Disaggregating revenue into categories—like specific product lines, geographic regions, or customer demographics—provides granular insight into performance drivers. This segmentation helps identify high-performing areas, declining trends, and new market opportunities.
- Compare actual revenue against forecasts and benchmarks
Regularly evaluate revenue performance against internal forecasts and industry standards. Variances can uncover emerging market trends, operational inefficiencies, or forecasting inaccuracies, enabling more precise planning and responsive strategy adjustments.
- Incorporate year-over-year and quarter-over-quarter analyses
YoY analysis highlights long-term growth patterns, while quarter-over-quarter (QoQ) evaluations uncover short-term shifts and seasonal influences. Together, they offer a comprehensive view of revenue evolution and guide both strategic and tactical decisions.
- Visualize data for better insight
Employ charts, dashboards, and graphs to translate complex revenue data into easily digestible visuals. Data visualization enhances pattern recognition, reveals anomalies, and supports more persuasive reporting to stakeholders.
- Analyze revenue alongside other financial metrics
Revenue alone doesn’t tell the full story. Evaluate it alongside metrics like profit margins, cash flow, and customer acquisition costs to assess the efficiency and sustainability of your growth.
- Identify and monitor key revenue drivers and risks
Pinpoint the core factors influencing revenue, such as pricing strategy, sales volume, or customer retention, and recognize potential risks. Monitoring these variables enables proactive adjustments to safeguard revenue streams and maximize profitability.
Conclusion
Understanding annual revenue is essential for evaluating a company’s financial health, measuring growth, and making informed business decisions. By accurately calculating and analyzing both operating and nonoperating revenue, businesses can gain valuable insights into performance and sustainability. Whether you’re a startup or an established company, maintaining clear and consistent revenue reporting is vital to long-term success.
If you need expert assistance in tracking or improving your company’s annual revenue, don’t hesitate to contact us at service@bbcincorp.com. Our team is ready to support your financial goals with reliable, professional solutions tailored to your business needs.
Frequently Asked Questions
What’s the difference between operating revenue and nonoperating revenue?
The main difference lies in the source of income:
- Operating revenue is the income a company earns from its core business activities, such as selling products or services. For example, a software company’s revenue from selling software licenses is considered operating revenue.
- Nonoperating revenue comes from secondary or non-core activities. This includes income from selling unused assets, earning interest, receiving dividends, or renting out property (if renting isn’t the main business).
Both types of revenues give a clearer picture of where a company’s money comes from and how sustainable its income is.
What is a good annual revenue for a small business?
A good annual revenue for a small business varies based on its size and structure. On average:
- A solo business owner with no employees earns about $44,000 per year.
- Businesses with 1–4 employees typically generate around $387,000 annually.
- Companies with up to 9 employees may earn close to $1 million per year.
In general, a “good” revenue means the business can cover its expenses, pay its owner(s), and generate profit for growth.
Disclaimer: While BBCIncorp strives to make the information on this website as timely and accurate as possible, the information itself is for reference purposes only. You should not substitute the information provided in this article for competent legal advice. Feel free to contact BBCIncorp’s customer services for advice on your specific cases.
Industry News & Insights
Get helpful tips and info from our newsletter!
Stay in the know and be empowered with our strategic how-tos, resources, and guidelines.

